📈
Standalone · NetworkableSales Performance
Pipeline, quota, win rate and rep leaderboard.
$10one-time

Sales, HR, banking & cash flow, finance, marketing and more — each a single ready-to-deploy file, and each one automatically links with the others like cells in a network. $10 each.
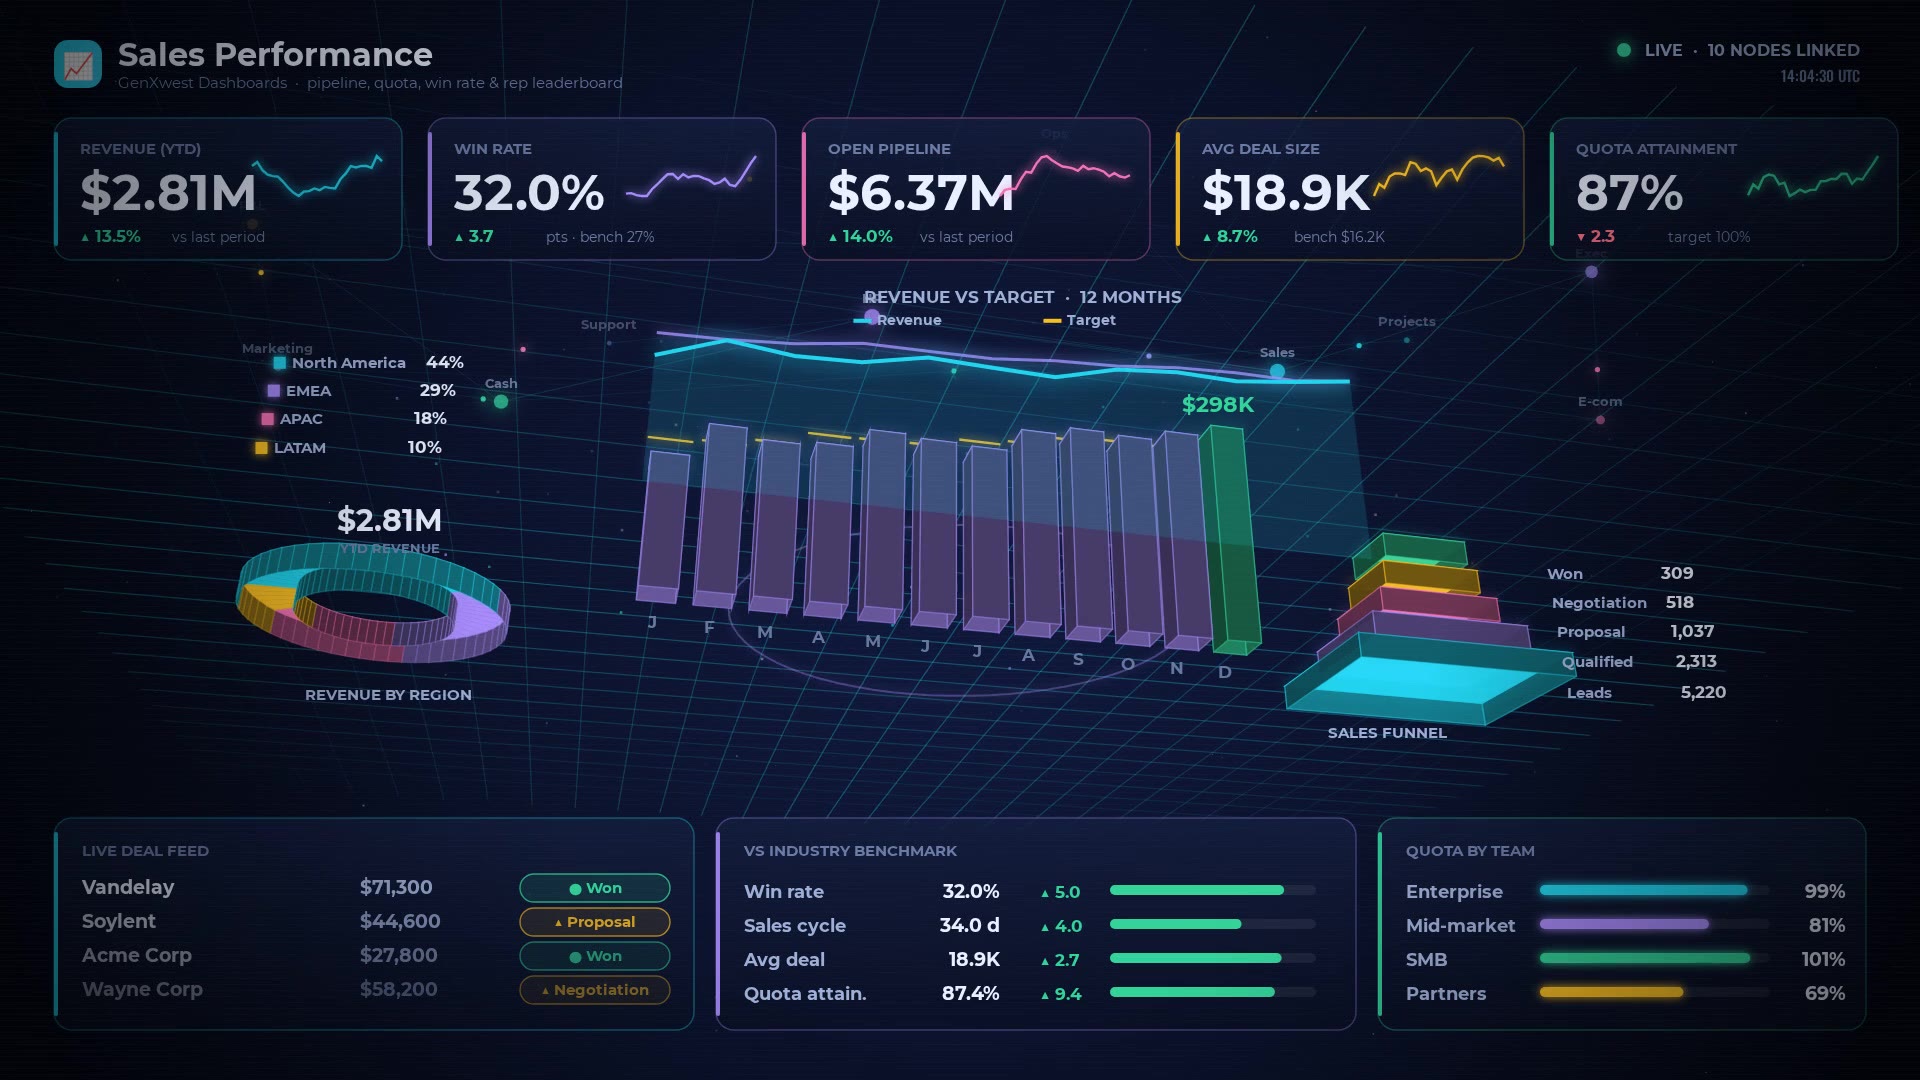
Every dashboard has a live demo — click through, hover the charts, sort the tables.
Pipeline, quota, win rate and rep leaderboard.
Headcount, hiring, turnover and engagement.
Balances, burn, runway, receivables and payables.
Profit & loss, margins and budget vs actual.
Traffic, channels, conversion and campaign ROI.
Ticket volume, SLA, CSAT and agent workload.
Fulfilment, stock levels, on-time delivery, capacity.
Status, milestones, budget burn and risk.
Orders, AOV, carts, products and repeat buyers.
MRR, churn, LTV:CAC and company OKRs in one glance.
45 seconds, recorded from the real dashboards — live 3D scenes, rolling tickers and linked networks.
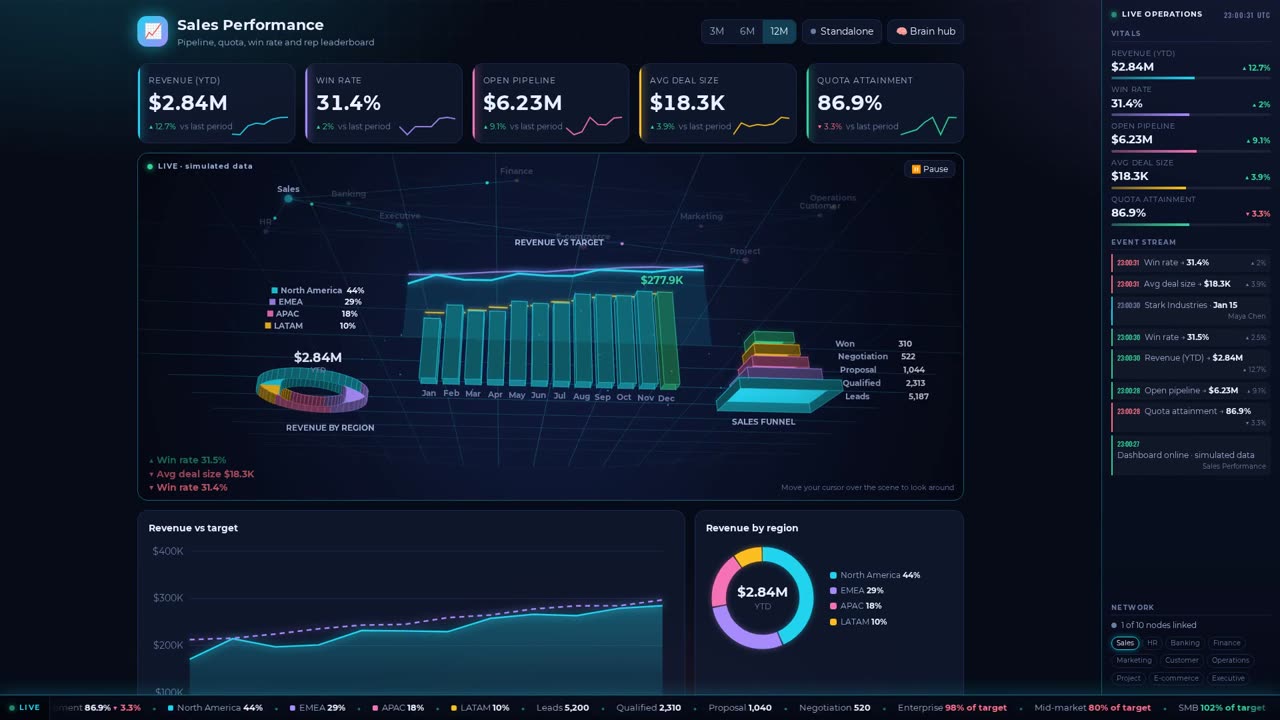
Each dashboard is a cell. Put several on the same site and they find each other.
One HTML file. No build step, no server, no database. Upload it to any web host.
Import a CSV into any table, or edit the settings block at the bottom of the file to load your own numbers.
Dashboards on the same site exchange their key metrics automatically. The Brain hub shows every connected node and live signals.
Developers can send or receive signals with GenXwest.send() and GenXwest.onMessage() to connect CRMs, banks or APIs.
Questions about a dashboard, a custom build, or linking your own data? Send a note and it goes straight to Steve.